Smart Strategy Acquires Azuki — A Cultural Axis Officially Emerges
JAPANDAOSolution
Smart Pocket Magazine
“I wonder how much buzz my favorite token is getting right now?”
Don’t you find yourself wondering this when trading tokens on Smart Pocket? Price is important, of course, but you’re probably also curious about community enthusiasm and holding patterns, right?
In response to these voices, Smart Analytics has finally been born.
Today, we’ll introduce you to this new tool that brings “visibility” to the Smart Pocket ecosystem.
Let me explain Smart Analytics once again.
Smart Analytics is an analytics dashboard that visualizes data from the entire Smart Pocket ecosystem in real-time.
Previously, to understand a token’s status, you had to navigate between individual token pages or do your own calculations. But Smart Analytics is different.
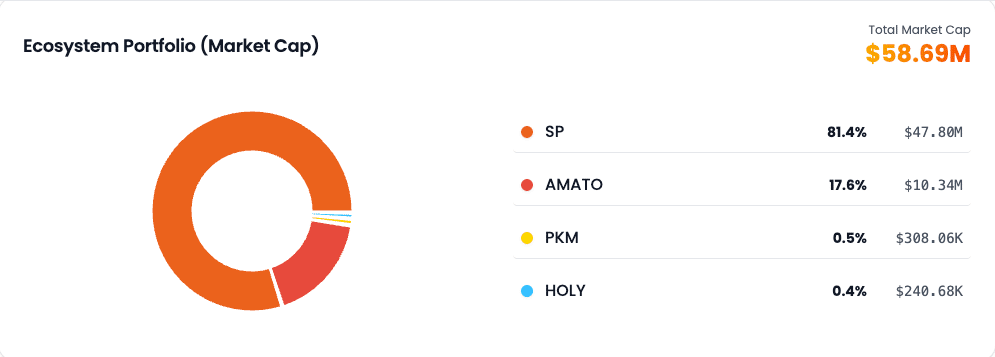
Total ecosystem market cap, price trends for each token, community enthusiasm, hold rates… all of these can be checked on a single screen.
This is the “transparent ecosystem” that Smart Analytics aims to achieve.
Access it here
https://analytics.smapocke.com
Let’s take a look at Smart Analytics’ main features.
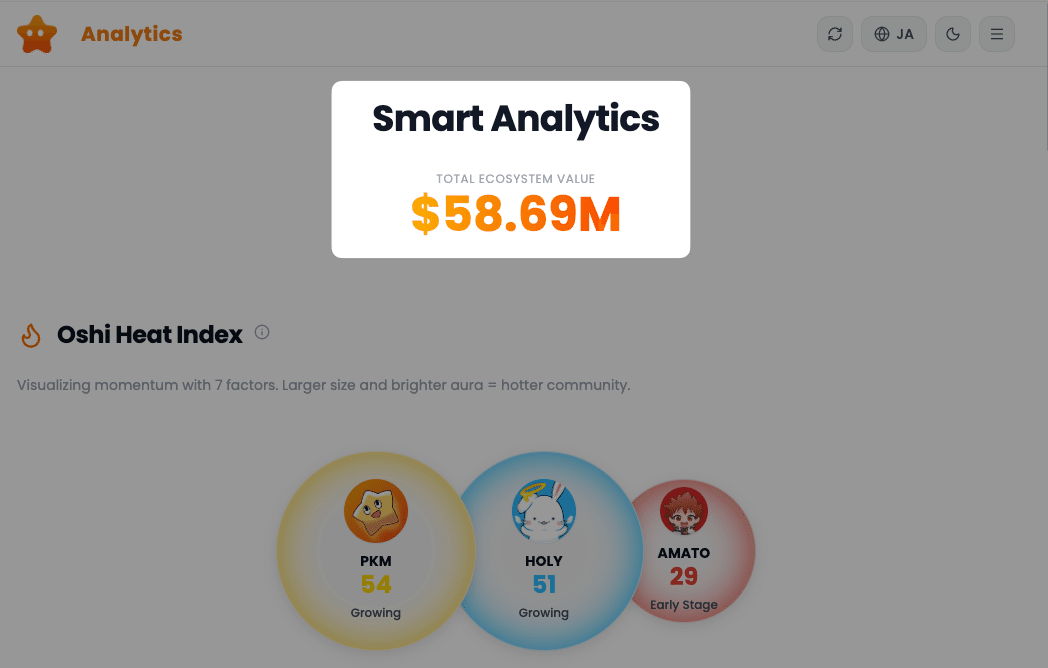
At the top of the screen, you’ll find indicators that show the health of the entire Smart Pocket ecosystem at a glance.
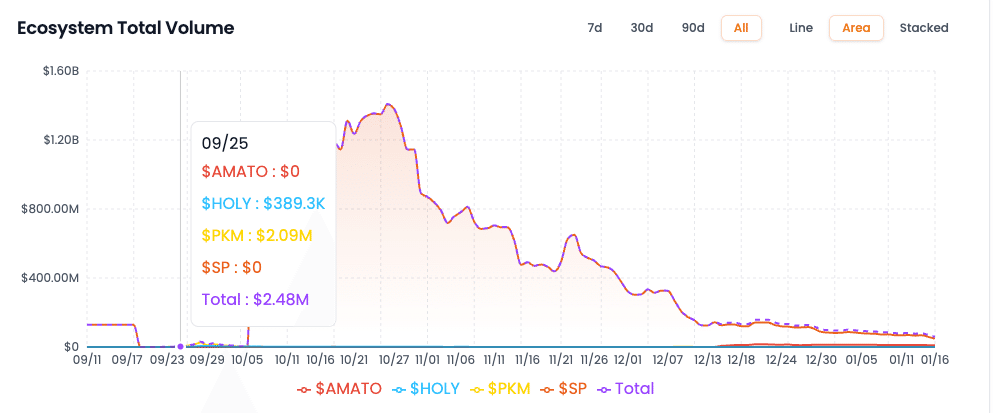
“How big is Smart Pocket right now?”
This question is answered instantly.
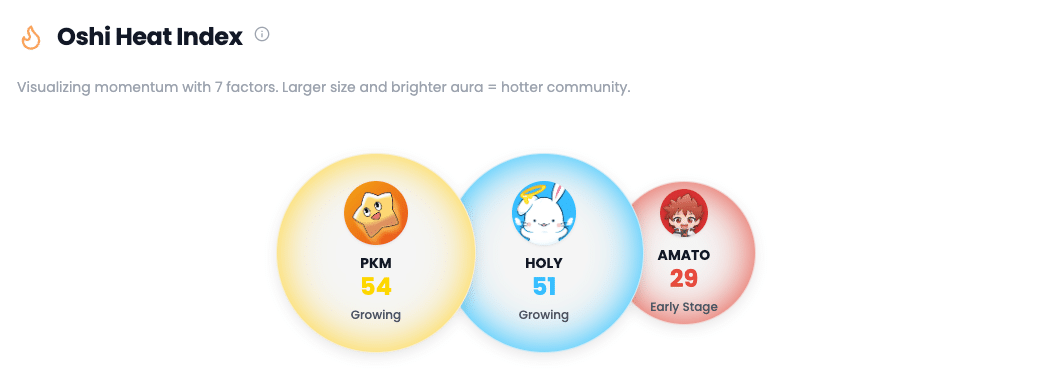
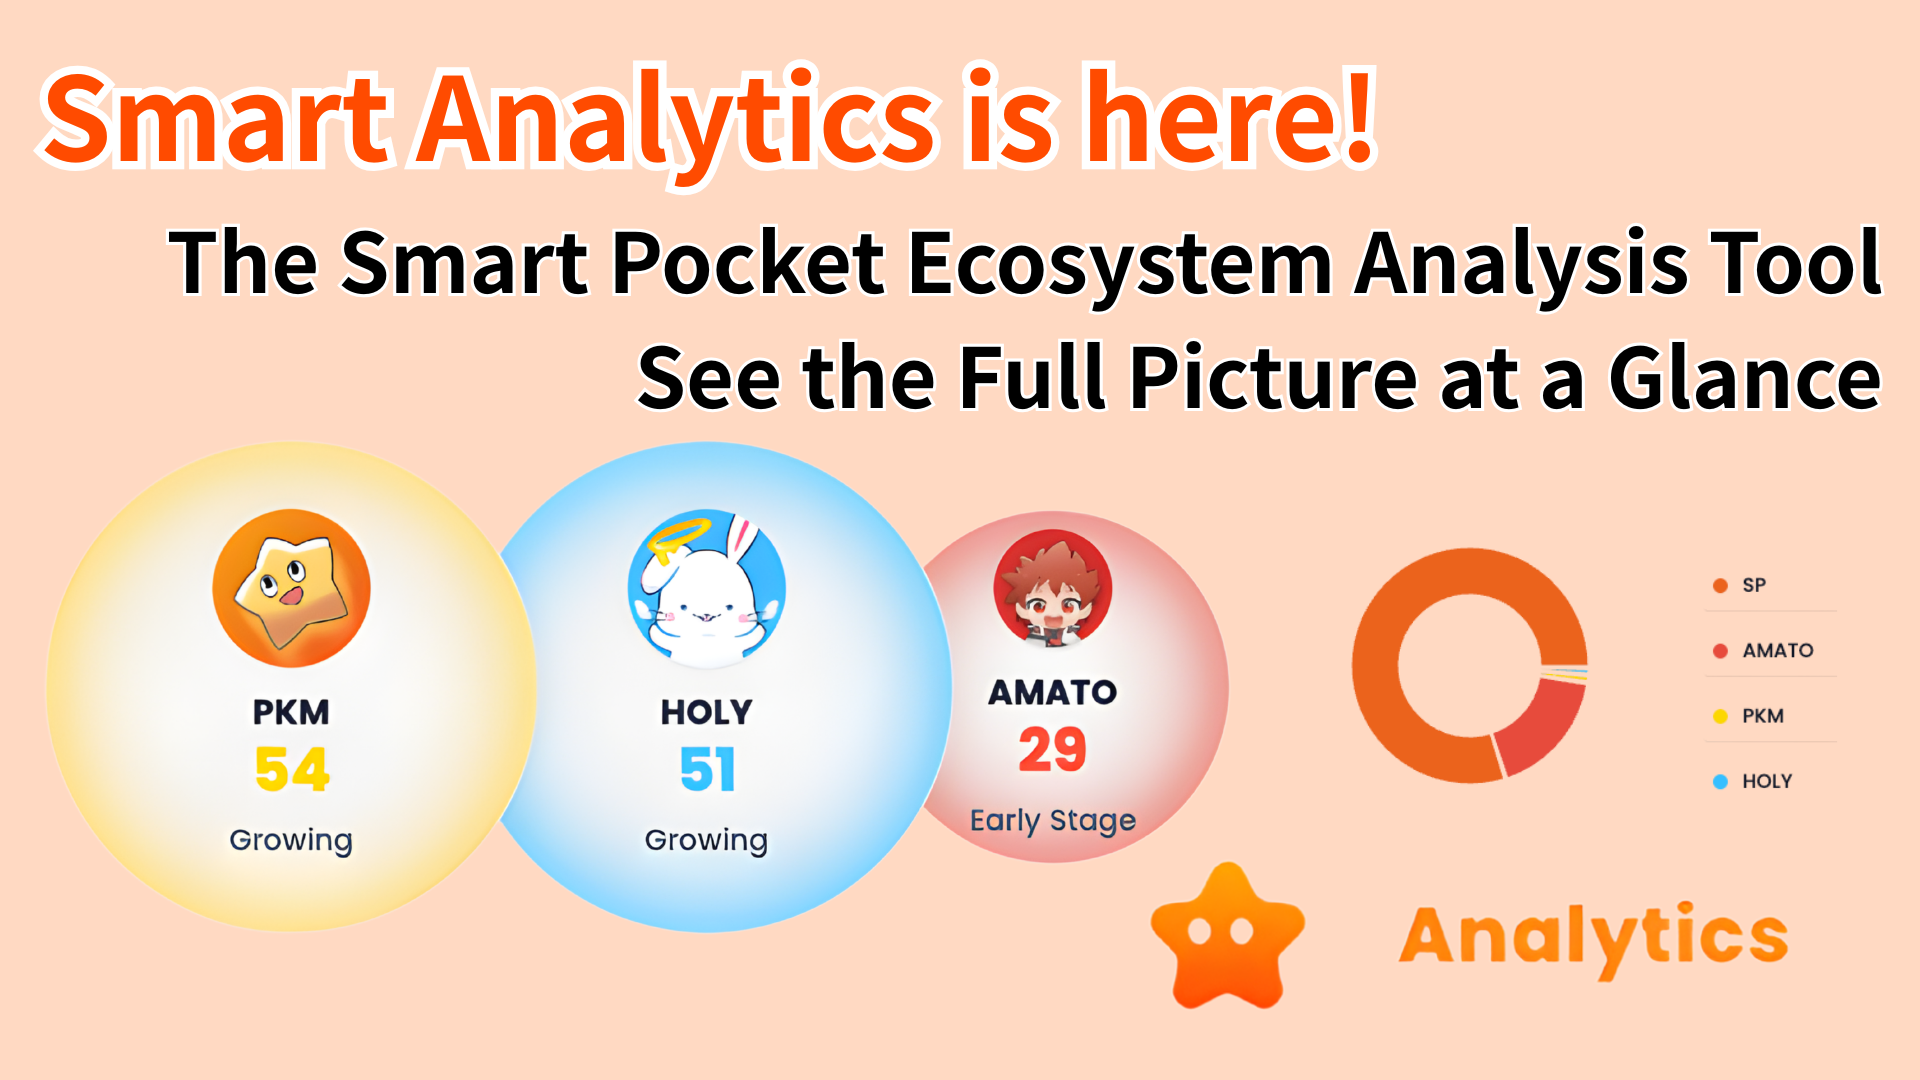
What is the Oshi Enthusiasm Index?
It’s a numerical representation of community interest and enthusiasm for each token. Beyond just price and market cap, you can see “how much it’s loved.”
For example:
This way, you can see at a glance how much enthusiasm each token has.
Why is the Oshi Enthusiasm Index Important?
A high-priced token doesn’t necessarily mean a good token, right?
Smart Pocket is an ecosystem where “everyone supports and everyone increases value together.” That’s why community enthusiasm matters.
Tokens with a high Oshi Enthusiasm Index are proof that they’re supported by core fans. It can be used as an indicator of expected long-term growth.
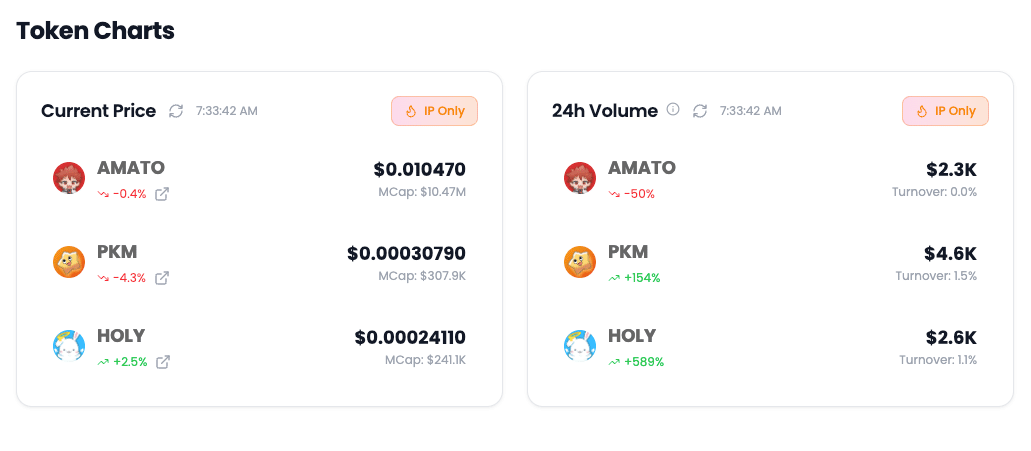
Detailed data for each token is also comprehensive.
Very helpful for timing your trades.
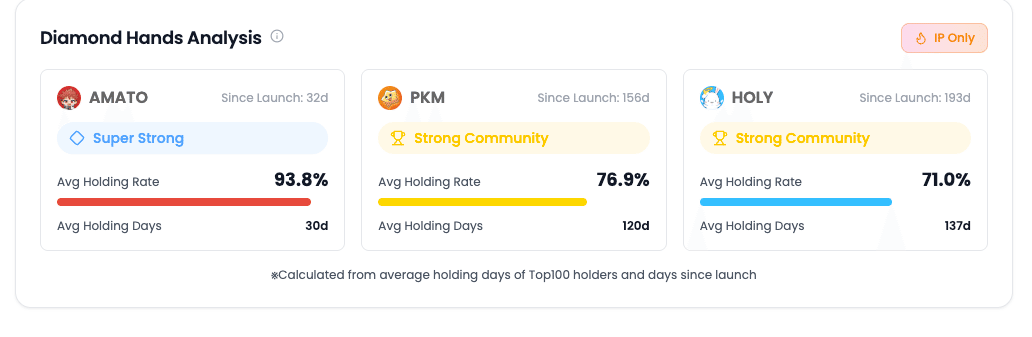
This is the true essence of Smart Analytics. Gachi-Ho Analysis visualizes how seriously the community is holding.
What is Gachi-Ho Rate?
It’s the “Average Hold Rate” calculated by dividing the average holding days of Top 100 holders by the days since launch.
Formula: Average Hold Rate = (Average Holding Days ÷ Days Since Launch) × 100%
Badges at a Glance!
BadgeCondition
🏆 Ultra Gachi-Ho90% or higher
💪 Strong Community70% or higher
✨ Stable Community50% or higher
🌱 Growing30% or higher
🆕 Emerging CommunityBelow 30%
“Is everyone really holding this token?”
Just look at the badge to instantly understand the community’s commitment level.
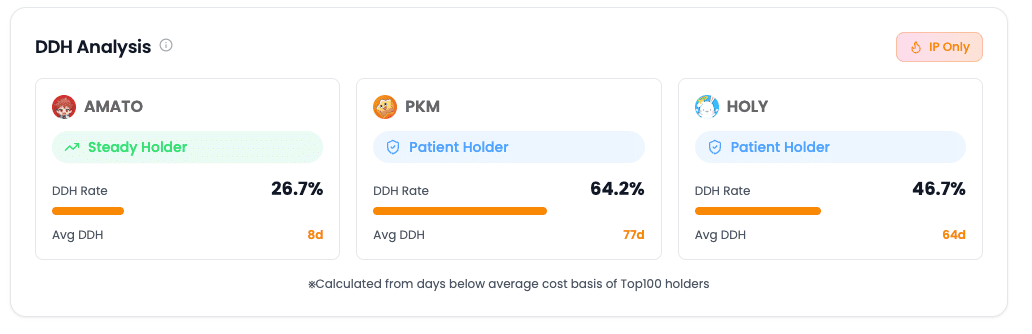
This is Smart Analytics’ most innovative feature.
What is DDH (Drawdown Days Held)?
It’s the number of days holders continued to hold while in an unrealized loss (below purchase price).
In other words, it’s an indicator that measures true diamond hands who “held on without selling even when prices dropped.”
Calculation Method
DDH Badges
BadgeDDH RateDescription
⚔️ Battle-Tested Hero70% or higherWarriors who endured the bear market
🛡️ Patient Holder40% or higherHeld through difficult times
⚓ Stable Holder20% or higherBalanced holding
⛵ Smooth SailingBelow 20%Relatively favorable price movement
Key Point: A high DDH rate = many true diamond hands who held without selling even during downturns.
This is a unique indicator exclusive to Smart Analytics that other analysis tools don’t have.
Enter your wallet address to check your holding days for each IP token.
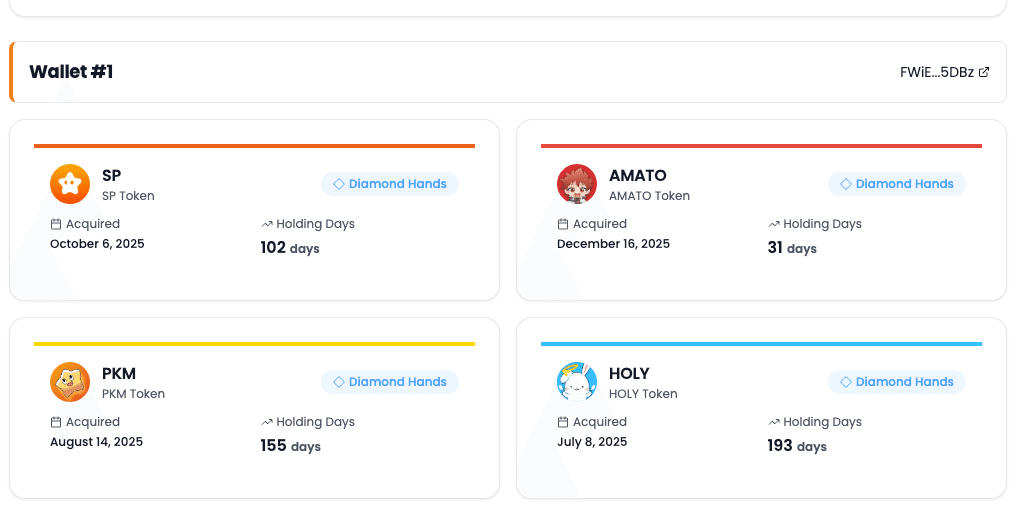
Formula: Hold Rate = (Holding Days ÷ Days Since Launch) × 100%
What’s Your Badge?
BadgeCondition
💎 Diamond Hands90% or higher
🥇 Gold Holder70% or higher
🥈 Silver Holder50% or higher
🥉 Bronze Holder30% or higher
🌱 New HolderBelow 30%
“How much am I actually diamond-handing?”
Just enter your wallet to check with objective numbers. Aim for Diamond Hands!
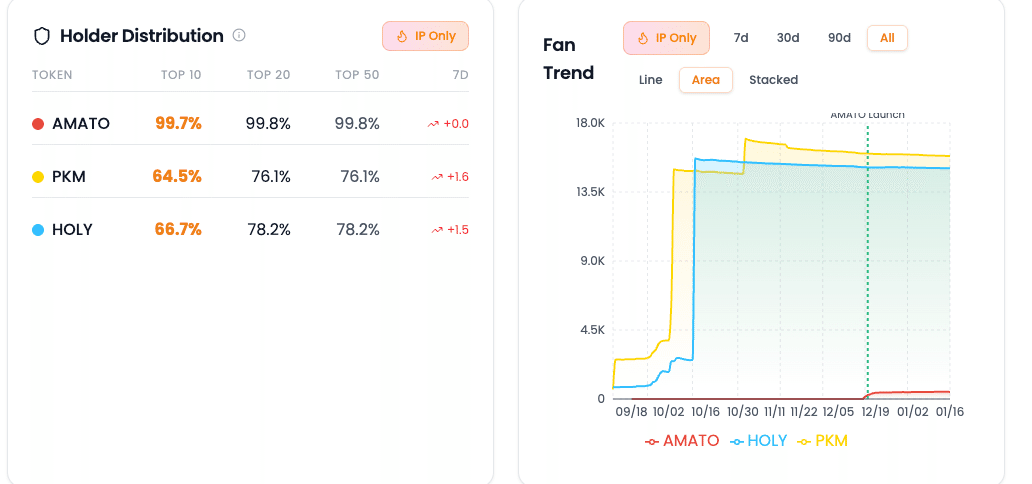
Oshi Heat Distribution
Displays the percentage held by hardcore fans (top fans).
You can see at a glance how much core fans support that token. Communities with higher enthusiasm tend to have higher numbers here.
Hako-Oshi Map (Multi-Token Fan Map)
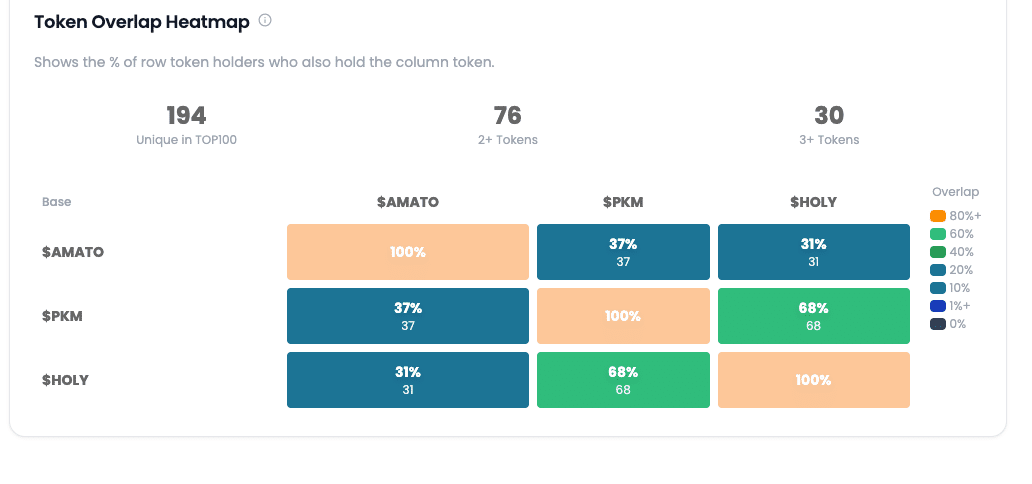
This is an interesting feature. It’s a heatmap showing the percentage of TOP 100 holders of one token (vertical axis) who also hold another token (horizontal axis).
“Do people who hold PKM also tend to hold HOLY?”
Such connections between communities become visible. The reality of Smart Pocket’s goal of “supporting each other” ecosystem can be seen through data.
Smart Pocket provides a next-generation exchange experience as a “Smart Exchange.”
This is not just an analysis tool.
We’re transforming from “mere traders” to “ecosystem participants.” And then to “community members who grow together.”
Smart Analytics is the tool that supports this transformation.
The Smart Pocket story has only just begun.
Using Smart Analytics, let’s watch the entire ecosystem grow together while energizing the community. Being able to see the data should make Smart Pocket even more enjoyable.
Why not aim for Diamond Hands with your wallet and be part of the ecosystem’s growth?
📢 Official Links